

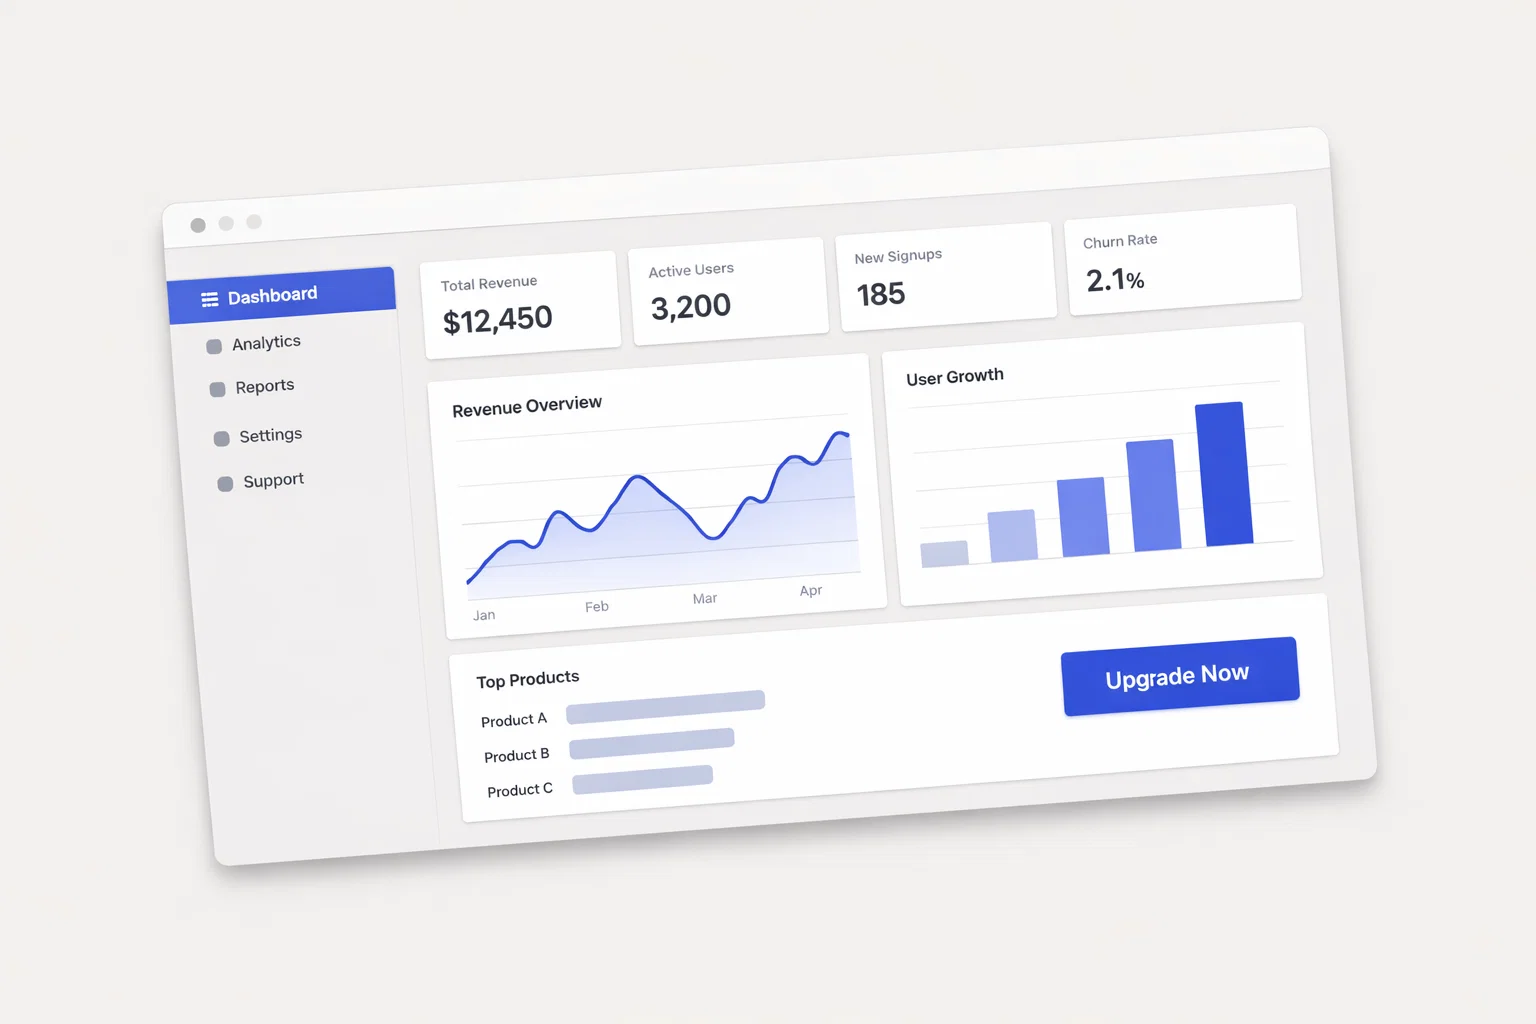
In the current capital market landscape of 2025–2026, the financial technology (Fintech) sector—specifically digital brokerage and wealth management applications—has evolved from a disruptive niche into a cornerstone of the global financial infrastructure. For the institutional and sophisticated individual investor, this sector represents a play on the “democratization of finance,” driven by artificial intelligence integration, fractionalization of assets, and the normalization of retail participation.
Investing in this niche requires a transition from viewing these entities as mere software companies to evaluating them as complex financial institutions with unique regulatory, liquidity, and operational risk profiles. This guide outlines a disciplined framework for capital allocation within the digital brokerage and fintech ecosystem.
Executive Summary: The Digital Brokerage Investment Thesis
The investment thesis for fintech and digital brokerage platforms centers on the structural shift in how global capital is intermediated. As legacy systems are replaced by agile, API-driven architectures, the capture of “Generation Wealth” (Millennials and Gen Z) provides a long-term growth runway. However, the sector is increasingly sensitive to interest rate cycles and regulatory shifts regarding monetization models like Payment for Order Flow (PFOF).
Strategic Takeaways:
- Primary Value Driver: Scaling User Base vs. Average Revenue Per User (ARPU) expansion through cross-selling (lending, insurance, crypto).
- Macro Dependency: High sensitivity to central bank policy and equity market volatility.
- Risk Profile: Elevated regulatory and cybersecurity risk; moderate-to-high capital intensity for scaling.
- Time Horizon: 3–7 years to capture full platform monetization cycles.
| Metric | Assessment | Comment |
| Growth Potential | High | Driven by global retail expansion and AI-advisory tools. |
| Risk Level | Moderate-High | Regulatory scrutiny and market volatility are primary headwinds. |
| Yield Profile | Low | Most platforms reinvest cash flow into R&D and acquisition. |
| Market Correlation | High | Strongly correlated with Nasdaq-100 and retail trading volumes. |
Understanding the Nature of Digital Brokerage Platforms
The economic logic of this niche rests on the “Platform Effect.” Unlike traditional banks that rely on physical branches, digital brokerages create value through high-margin, scalable software that facilitates transaction execution, margin lending, and asset custody. In the 2025–2026 era, value creation has shifted from “zero-commission” lures to “ecosystem stickiness,” where a single application serves as a comprehensive financial hub.
Structural Characteristics:
- Asset-Light Distribution: Digital-first onboarding reduces the cost-to-serve significantly compared to traditional incumbents.
- Monetization Diversity: Revenue is derived from net interest margin (NIM) on uninvested cash, transaction markups, and subscription-based “Pro” tiers.
- Data Dominance: Real-time sentiment data and behavioral analytics allow for personalized product pushing and risk management.
| Feature | Digital Brokerage Platforms | Traditional Financial Institutions |
| Acquisition Cost | Low (Digital Marketing) | High (Branch & Human Capital) |
| Service Model | Self-Service / AI-Driven | Relationship Manager / Human-Led |
| Product Velocity | High (Weekly Updates) | Low (Quarterly/Annual Cycles) |
| Reg. Framework | Tech-Forward / Evolving | Legacy / Highly Rigid |
Macroeconomic Drivers Affecting the Fintech Sector
As we navigate the 2025–2026 cycle, fintech valuations are no longer solely dependent on “growth at any cost.” The normalization of interest rates has refocused investors on profitability and the ability to generate interest income from client cash balances.
Key Macro Factors:
- Interest Rate Normalization: Higher rates generally benefit platforms with large cash deposits (increasing NIM), while potentially dampening retail trading activity in speculative assets.
- Inflation Dynamics: Persistent inflation affects the discretionary income of the retail cohort, directly impacting monthly deposit rates.
- Global Capital Flows: The rise of cross-border retail investing allows platforms to tap into emerging market wealth, diversifying their geographic revenue risk.
| Macro Factor | Impact Direction | Sensitivity Level |
| Benchmark Rates | Positive (Income) / Negative (Valuation) | Very High |
| GDP Growth | Positive (AUM Growth) | Moderate |
| Regulatory Reform | Negative (Compliance Costs) | High |
| USD Strength | Mixed (Affects International Expansion) | Moderate |
Market Structure of Digital Financial Intermediaries
The market is characterized by a “Barbell Structure”: a few dominant global players (incumbents who have pivoted to digital) and a swarm of high-growth, niche innovators. Entry barriers have risen significantly due to the increased cost of regulatory compliance and the “liquidity moat” established by larger platforms.
Market Participants:
- Digital-Native Brokers: Agile firms focused on UI/UX and retail engagement.
- Legacy Pivoters: Traditional wirehouses launching digital-only sub-brands.
- Neobanks: Banking apps expanding into equity and commodity trading.
- Infrastructure Providers: “Brokerage-as-a-Service” APIs that power non-financial apps.
Note: Consolidation is a primary theme in 2026. Larger platforms are aggressively acquiring smaller competitors to gain licenses in new jurisdictions or to integrate specialized AI-trading technologies.
Investment Vehicles for Gaining Exposure
Investors can gain exposure to this niche through various instruments, ranging from direct equity in public platforms to diversified thematic funds.
| Vehicle | Liquidity | Cost | Risk Level | Suitable For |
| Individual Equities | High | Low | High | Active Stock Pickers |
| Fintech ETFs (e.g., FINX, IPAY) | High | Moderate | Moderate | Diversified Growth Seekers |
| Private Equity / Venture | Low | High | Very High | Institutional / Accredited |
| Convertible Bonds | Moderate | Moderate | Moderate | Income + Upside Potential |
Access Process:
- Direct Equity: Purchase shares of publicly traded brokerage firms via primary exchanges.
- Thematic ETFs: Allocate to funds that basket fintech, blockchain, and payment processors.
- Derivative Overlays: Use long-dated call options (LEAPs) to capture growth with defined downside.
Fundamental Analysis Framework
When evaluating a digital brokerage platform, traditional P/E ratios often fail to capture the full picture. Analysts must focus on unit economics and the quality of the “AUM (Assets Under Management) Mix.”
Key Performance Indicators (KPIs):
- CAC to LTV Ratio: The cost to acquire a customer versus their lifetime value. A ratio $>3:1$ is generally considered healthy.
- Monthly Active Users (MAU): A measure of platform stickiness and engagement.
- Net Deposit Flow: The true indicator of organic growth, independent of market price appreciation.
| Valuation Metric | Formula / Definition | Target Range (Ideal) |
| Price / Sales (P/S) | Market Cap / Annual Revenue | Variable by Growth Rate |
| ARPU | Total Revenue / Total Users | Increasing QoQ |
| Churn Rate | Users Lost / Total Users | $<5\%$ Annually |
| NIM Sensitivity | $\Delta$ Interest Income / $\Delta$ 100bps Rate | Positive Correlation |
Risk Assessment in Fintech Investing
The primary risk in 2026 is no longer technology failure, but regulatory intervention. As digital platforms gain systemic importance, they face increased scrutiny regarding “gamification” and the transparency of their execution models.
Risk Mapping:
- Market Risk: Downturns in equity markets reduce trading volume and AUM-based fees.
- Regulatory Risk: Sudden bans on PFOF or increased capital reserve requirements.
- Cybersecurity Risk: A single significant data breach can lead to irreparable brand damage and massive outflows.
| Risk Type | Probability | Impact | Mitigation Strategy |
| Regulatory Shift | High | High | Invest in geographically diversified platforms. |
| Cyber Breach | Moderate | Extreme | Prioritize firms with “Institutional Grade” security. |
| Market Volatility | Certain | Moderate | Focus on platforms with diversified revenue. |
Portfolio Allocation Strategy
Fintech and digital brokerage investments should typically reside within the Aggressive Growth or Thematic sleeve of a diversified portfolio. Due to their high correlation with broader technology indices, they should be balanced with defensive assets.
Allocation Method:
- Determine Sleeve Size: Typically 5%–10% of total equity allocation.
- Benchmark Selection: Compare performance against the KBW Nasdaq Financial Technology Index.
- Rebalancing: Execute quarterly rebalancing to harvest gains during periods of retail “euphoria.”
| Scenario | Growth Portfolio | Balanced Portfolio | Defensive Portfolio |
| Weighting | 12% – 15% | 4% – 6% | 1% – 2% |
| Role | Alpha Generation | Diversification | Small Growth Kicker |
ESG and Sustainability Considerations
In 2026, ESG in fintech focuses on “Financial Inclusion” and “Governance of AI.” Investors are increasingly looking at how these platforms protect vulnerable retail traders from excessive risk.
ESG Factors:
- Social: Democratizing access to sophisticated investment products.
- Governance: Transparency in order routing and board independence.
- Environmental: Energy efficiency of server farms and digital infrastructure.
| ESG Factor | Relevance | Risk Level |
| Financial Literacy | High | Low (Social Positive) |
| Data Privacy | Extreme | High (Governance Risk) |
| Algorithm Bias | Moderate | Moderate (Regulatory Risk) |
Implementation Roadmap for Investors
- Define Objective: Are you seeking capital appreciation (Growth) or a play on rising interest rates (NIM)?
- Assess Tolerance: Ensure you can withstand 20%–30% sector drawdowns during market corrections.
- Screen Candidates: Use the fundamental framework to filter for platforms with positive net flows and rising ARPU.
- Size Position: Avoid over-concentration; start with a 2% “starter” position.
- Monitor Regulation: Track SEC (US), FCA (UK), and ESMA (EU) announcements regarding retail trading rules.
Appendix: Analytical Tools and Data Sources
To conduct institutional-level analysis, use the following metrics and sources:
Performance Formulas:
$$Risk-Adjusted Return = \frac{R_p – R_f}{\sigma_p}$$
(Where $R_p$ is portfolio return, $R_f$ is risk-free rate, and $\sigma_p$ is standard deviation).
Data Sources:
- SEC EDGAR: For 10-K and 10-Q filings (Public Platforms).
- AppTopia / SensorTower: For real-time download and engagement data.
- Crunchbase: For private market funding rounds and valuation steps.
Frequently Asked Questions
- What is the minimum capital required? Many platforms now allow fractional investing, making the niche accessible with as little as $100, though institutional-grade analysis requires access to professional data terminals.
- What is the biggest mistake to avoid? Overestimating the value of “User Count” without looking at the “Quality of Assets.” A million users with $10 balances are less valuable than 10,000 users with $10,000 balances.
How does AI change the niche in 2026? AI is shifting from a “chatbot” feature to an autonomous “Agentic Advisor” that can rebalance portfolios and execute tax-loss harvesting automatically, increasing platform value